Cairn
Thesis Faculty:
John Sharp, Andrew Zornoza, David Carroll, Barbara MorrisA speculative IoT smart home system that builds a digital portrait of a home’s emotional climate as an extension of the quantified self.
Overview
Cairn uses machine learning to analyze for data deviations as related to emotions from existing wearables of individuals in the home and smart home system. Users can choose to share their aggregate data locally with others in the home with the intent of providing insights on their emotional state for improved understanding and communication. The way we treat both ourselves and others, especially in our most intimate spaces, highly affects our quality of life and it is the design’s intent to encourage increased expression, communication, and deeper understanding of the people around us. Cairn is contextualized as existing in the designer’s vision of a near future where wearable technology is as ordinary as a phone or a key, and in which the data those devices generate is understood to belong to the people who produce it rather than to the platforms that collect it.
In this future, artificial intelligence has become less of a novelty and more of a quiet infrastructure, processing and reasoning in the background of daily life. In this future, AI does not harm, but merely exists as nature does, existing in symbiosis with humans. This work also serves to initiate education and reflection on data collection and storage by wearables and smart home systems currently on the market. Although Cairn is speculative, the technology needed for it already exists and it is our responsibility to be active participants in shaping the ethical and security landscape that data privacy principles and surveillance technologies operate in.
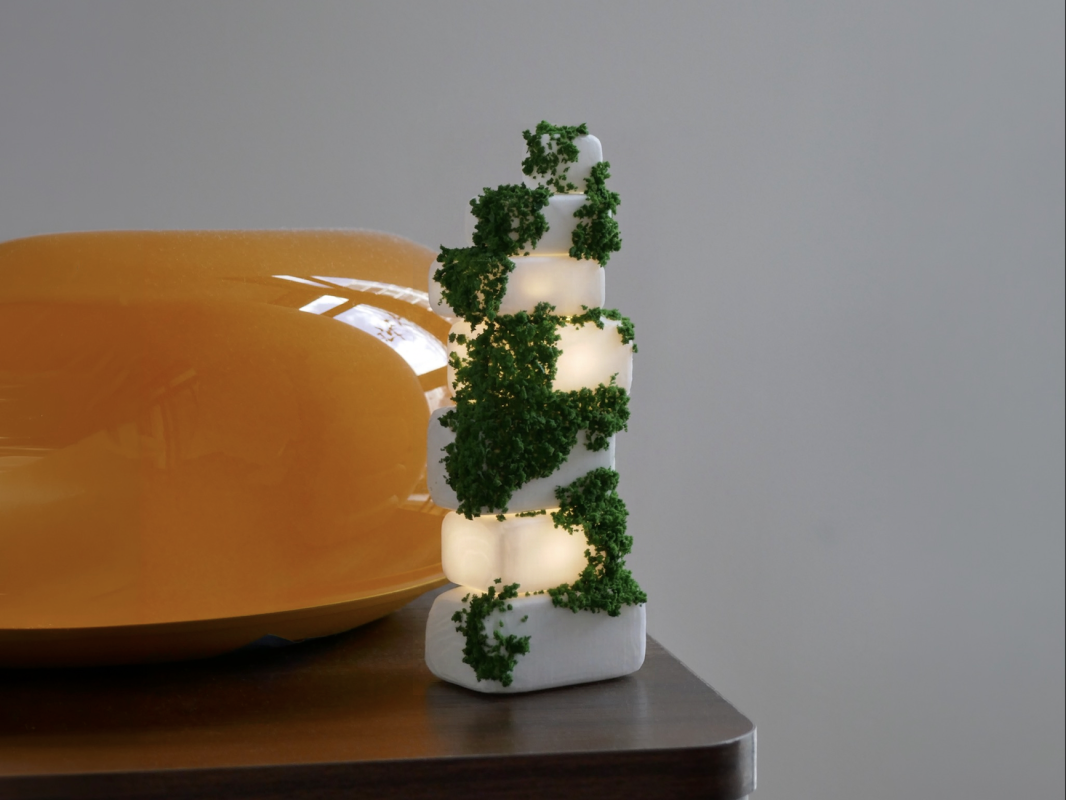
The Design

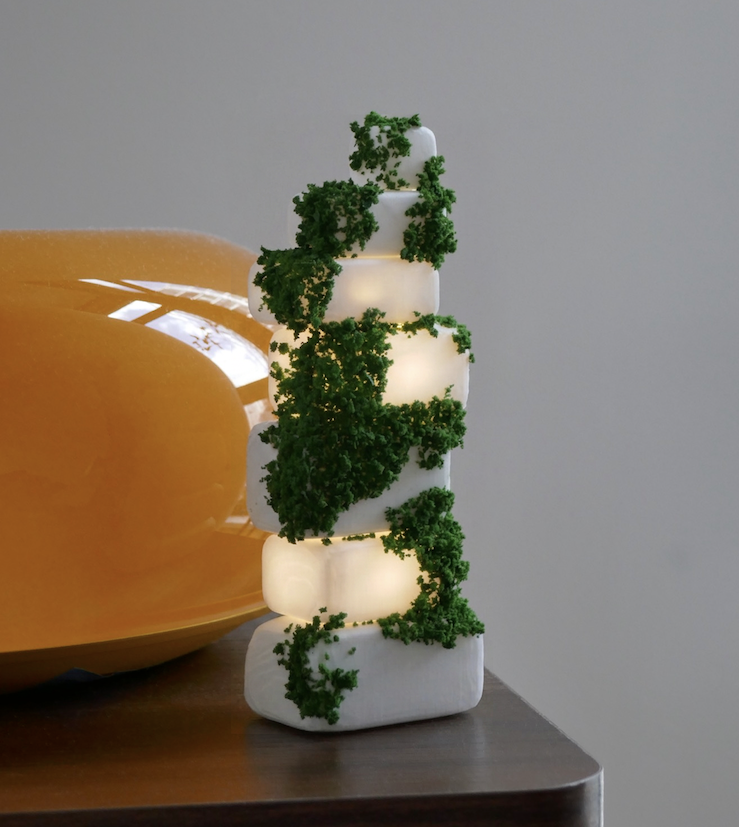
The different sensors are found in the gaps between the blocks, where they are concealed from immediate sight, but still functioning.
Light is used as a visual indicator as an ON/OFF state.
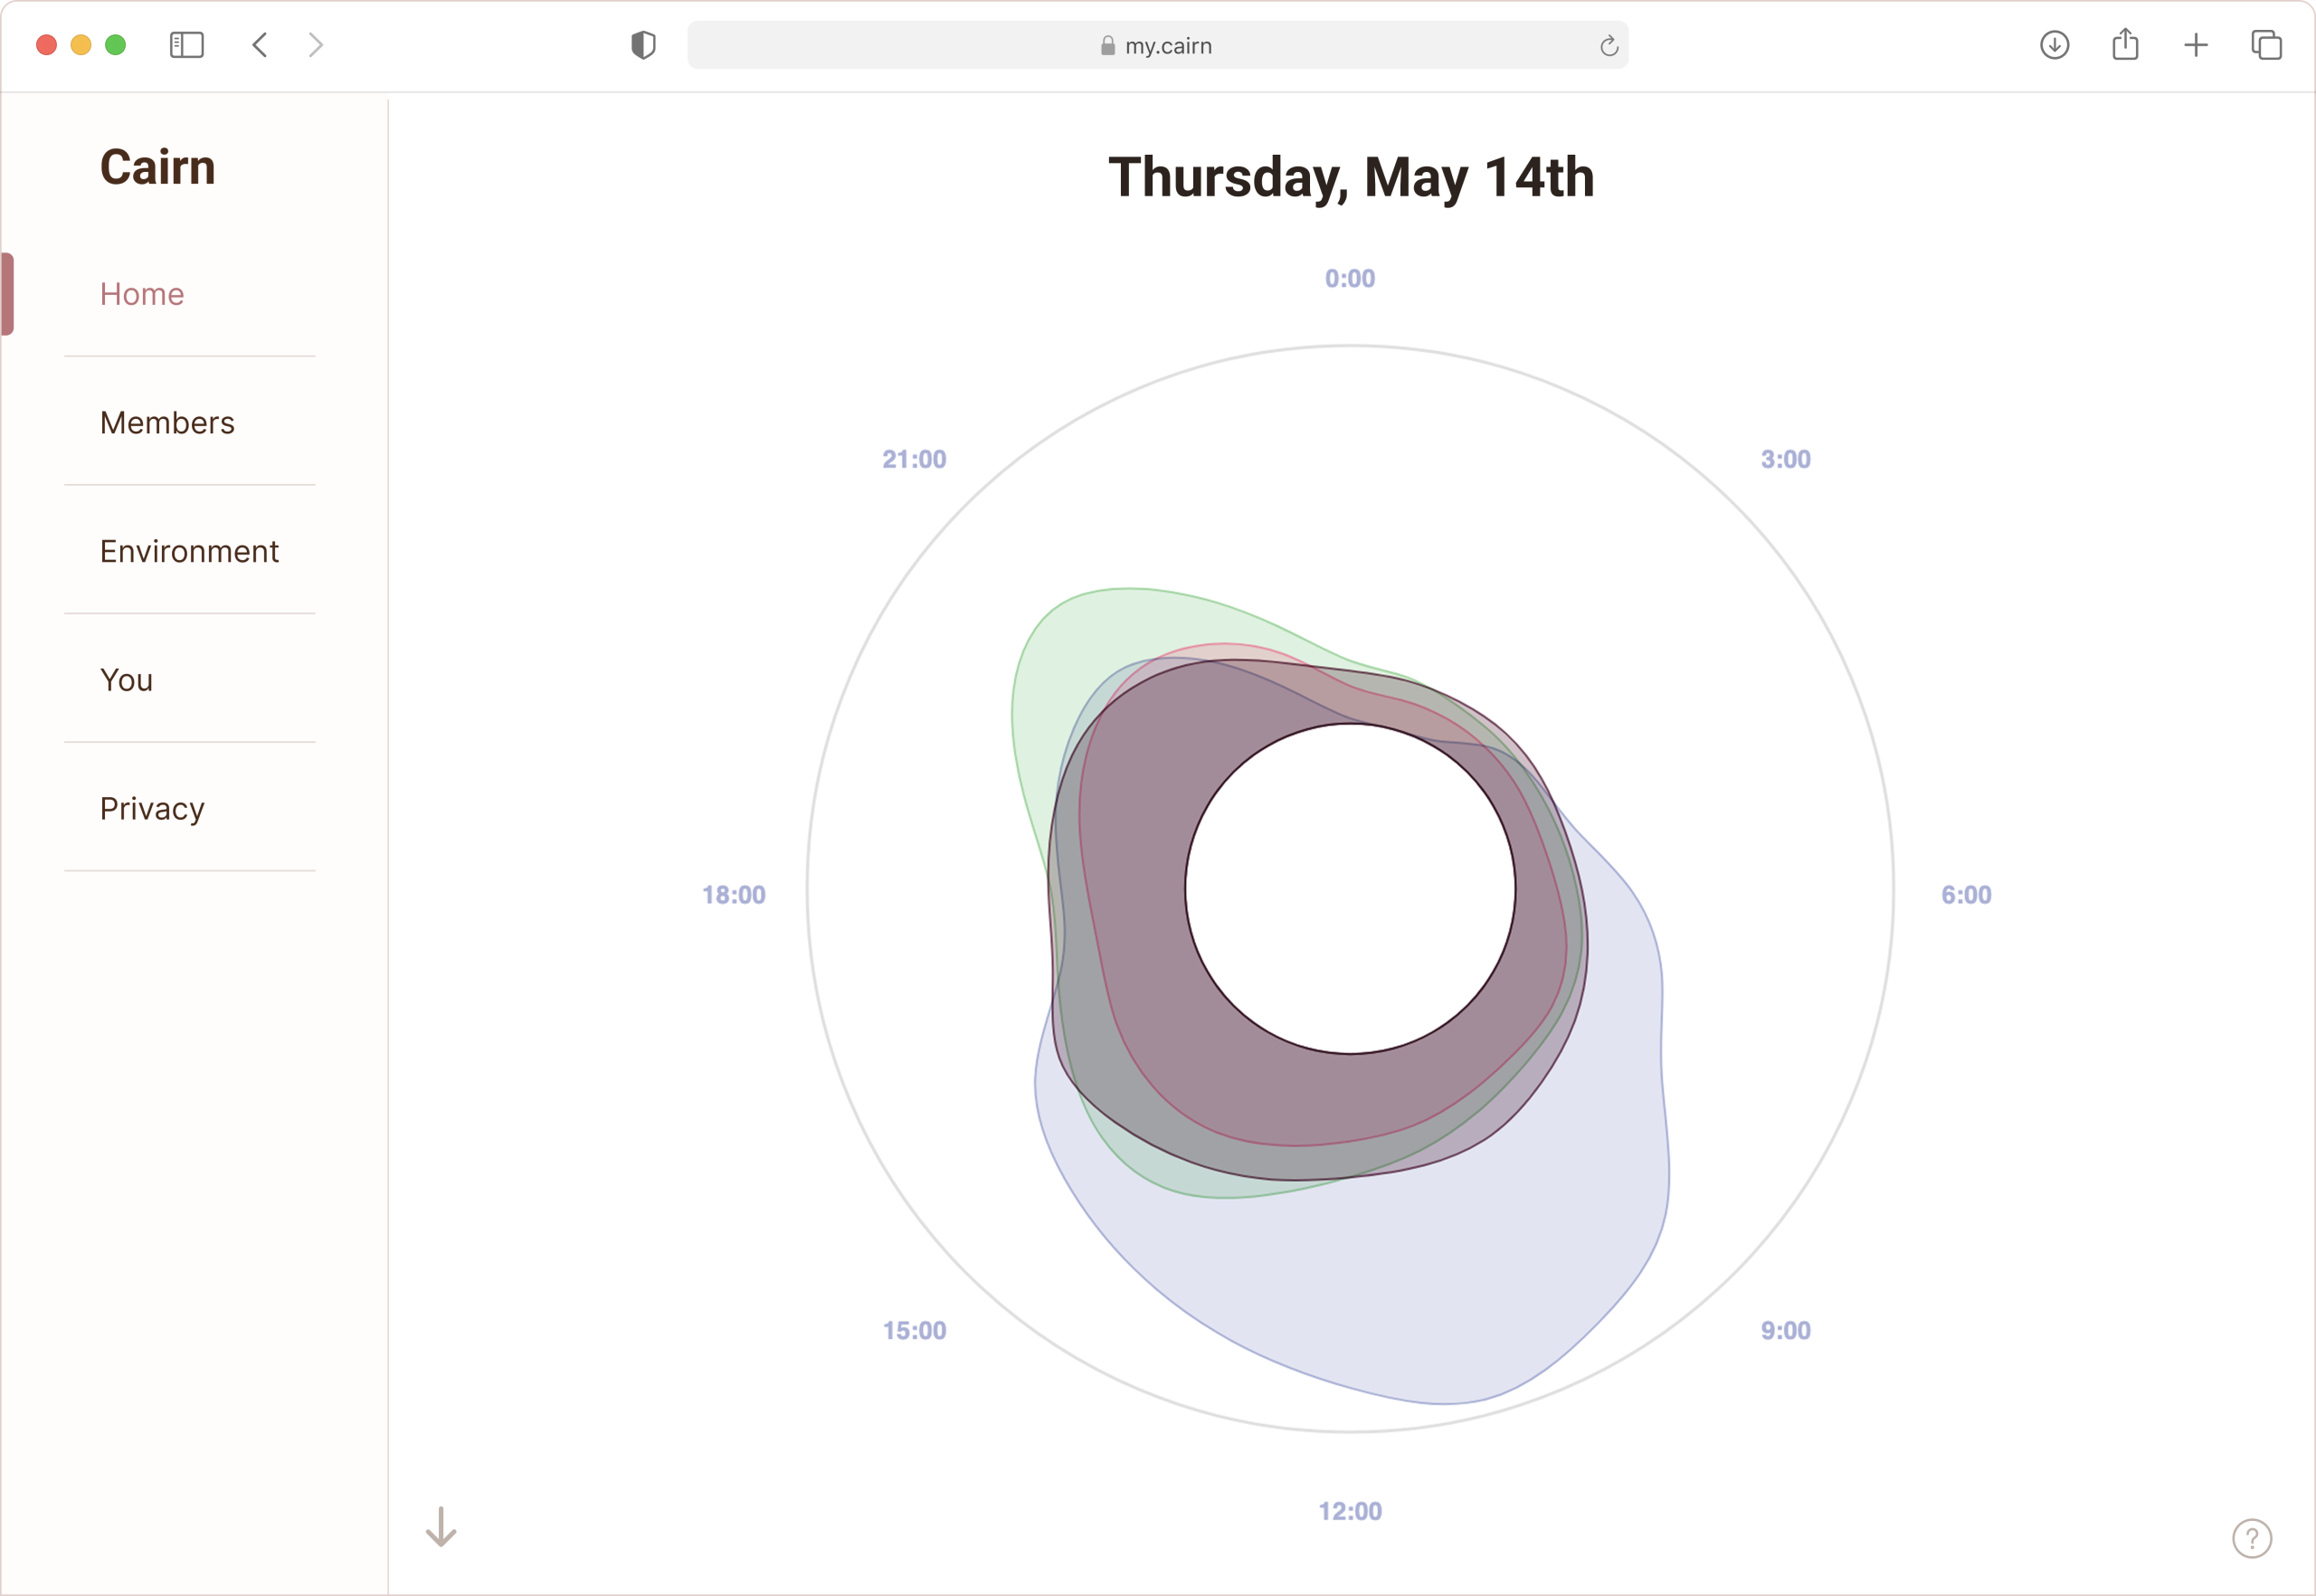
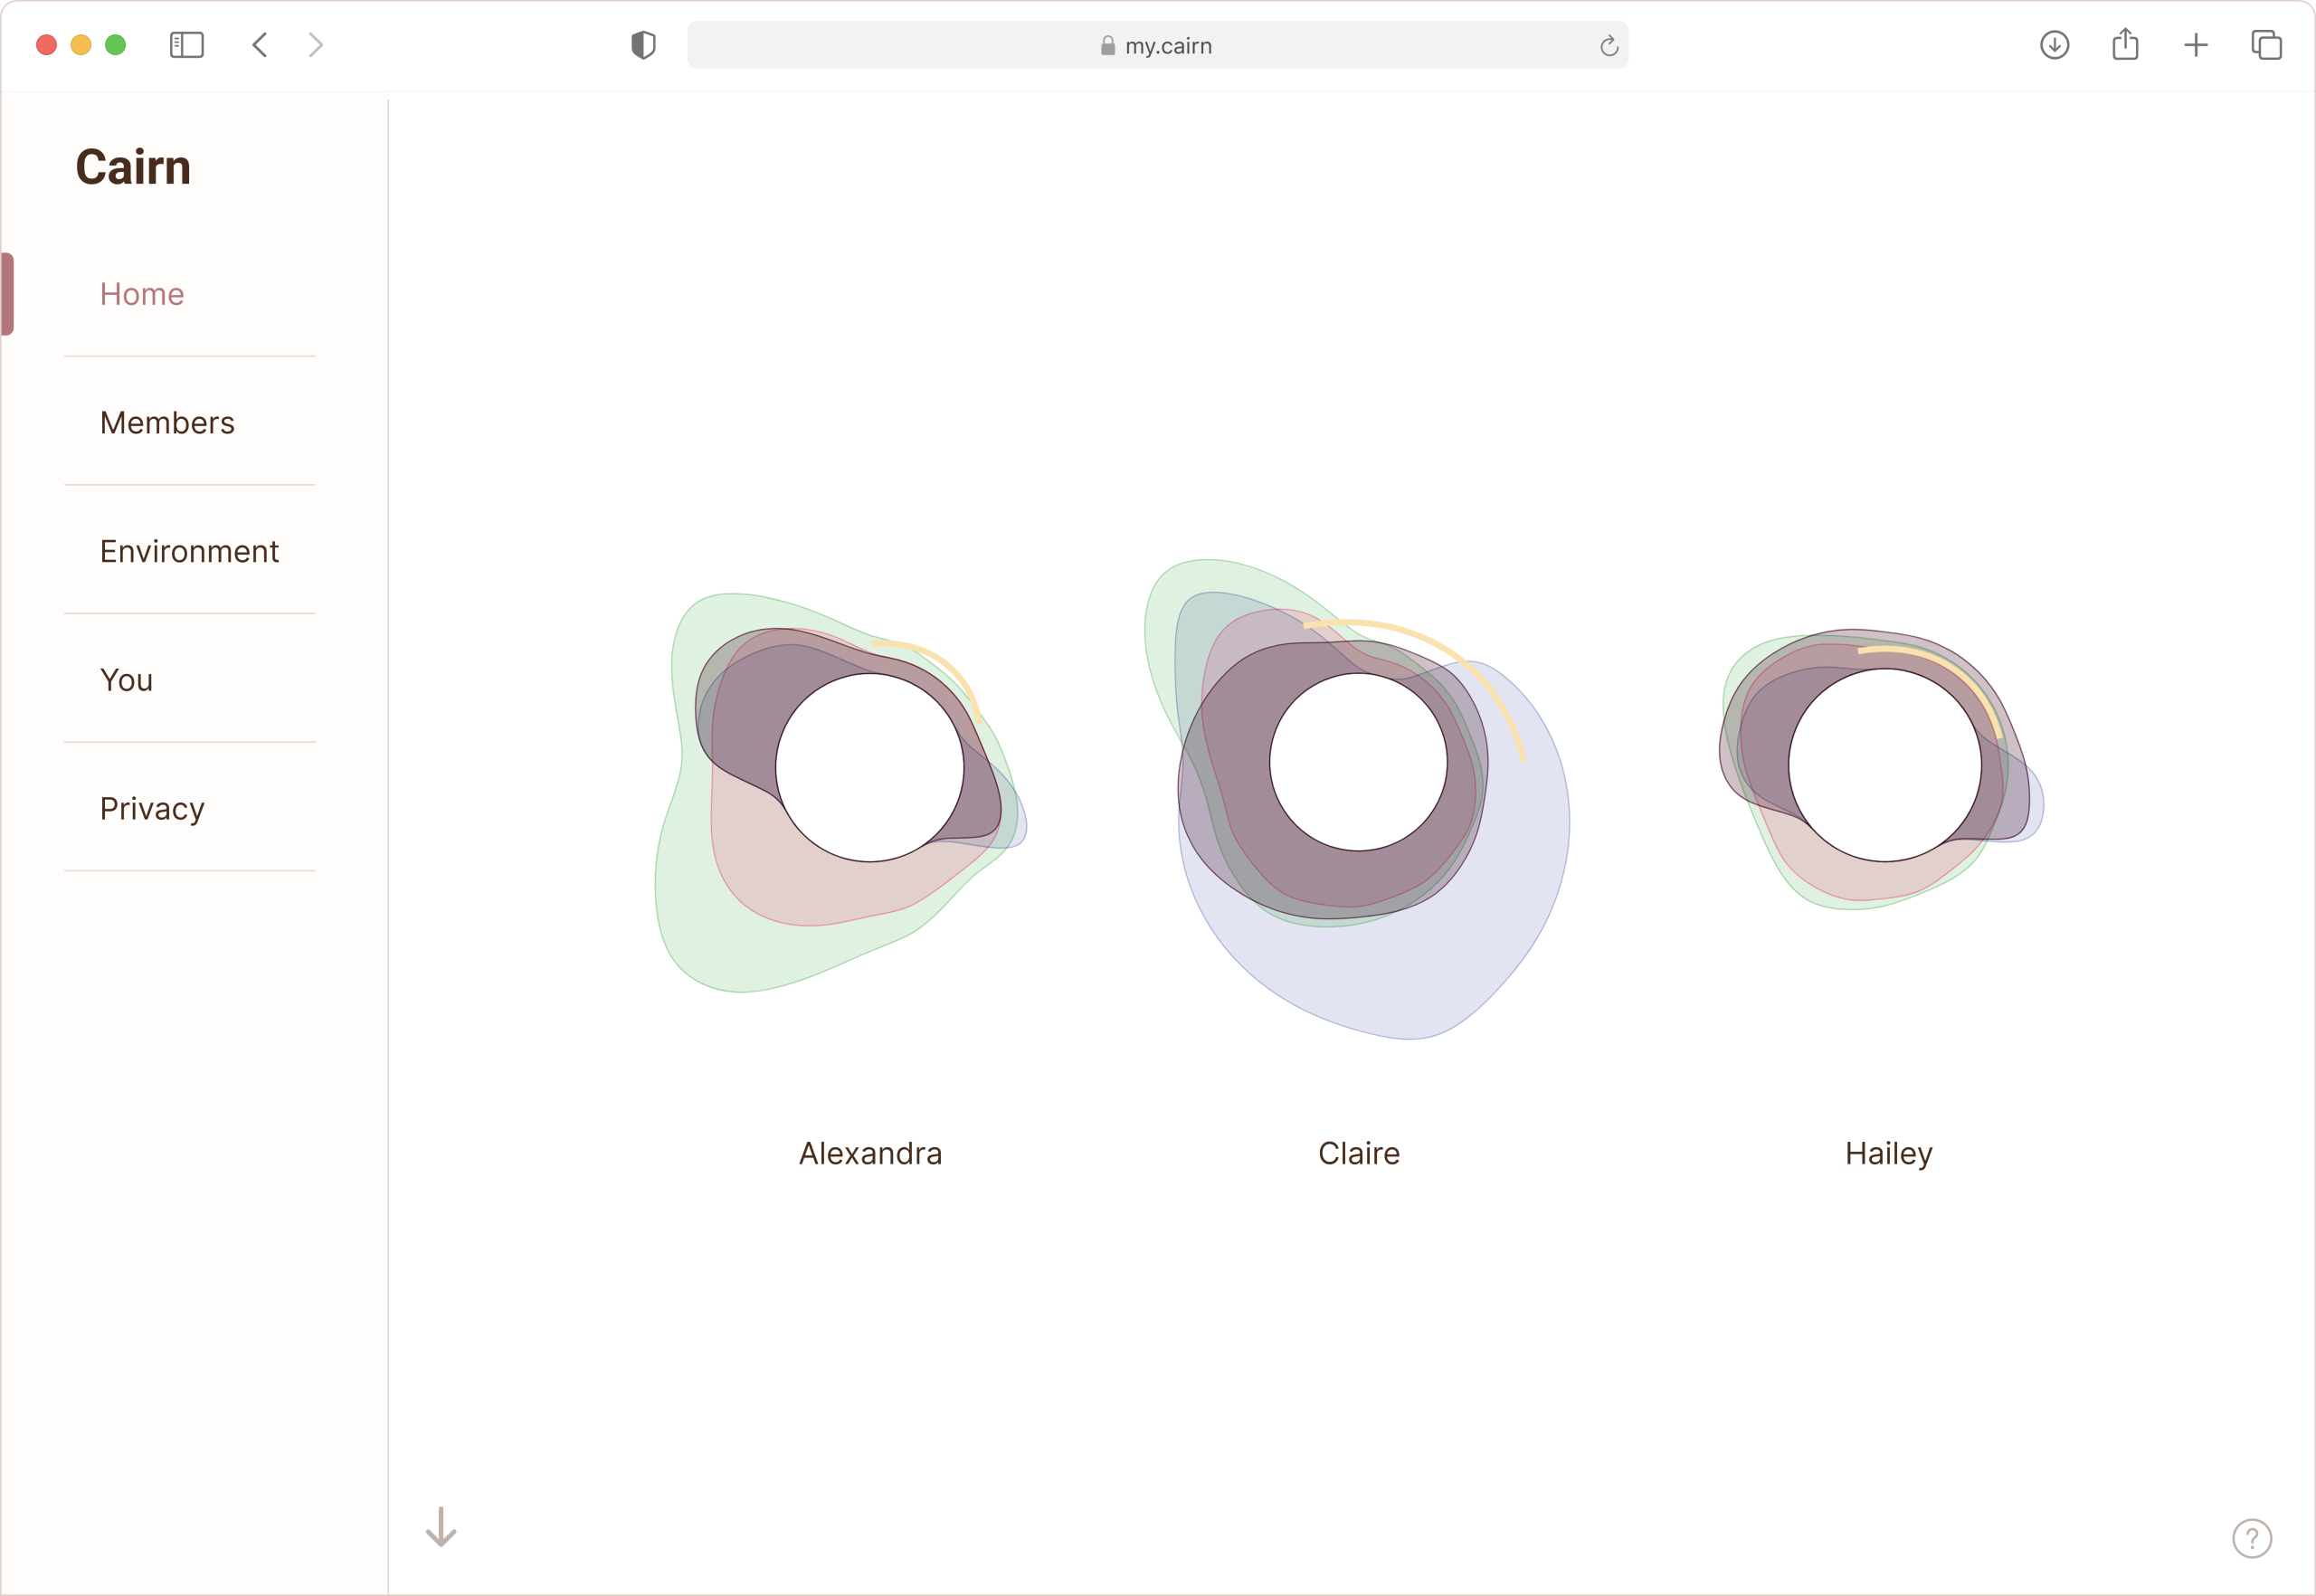
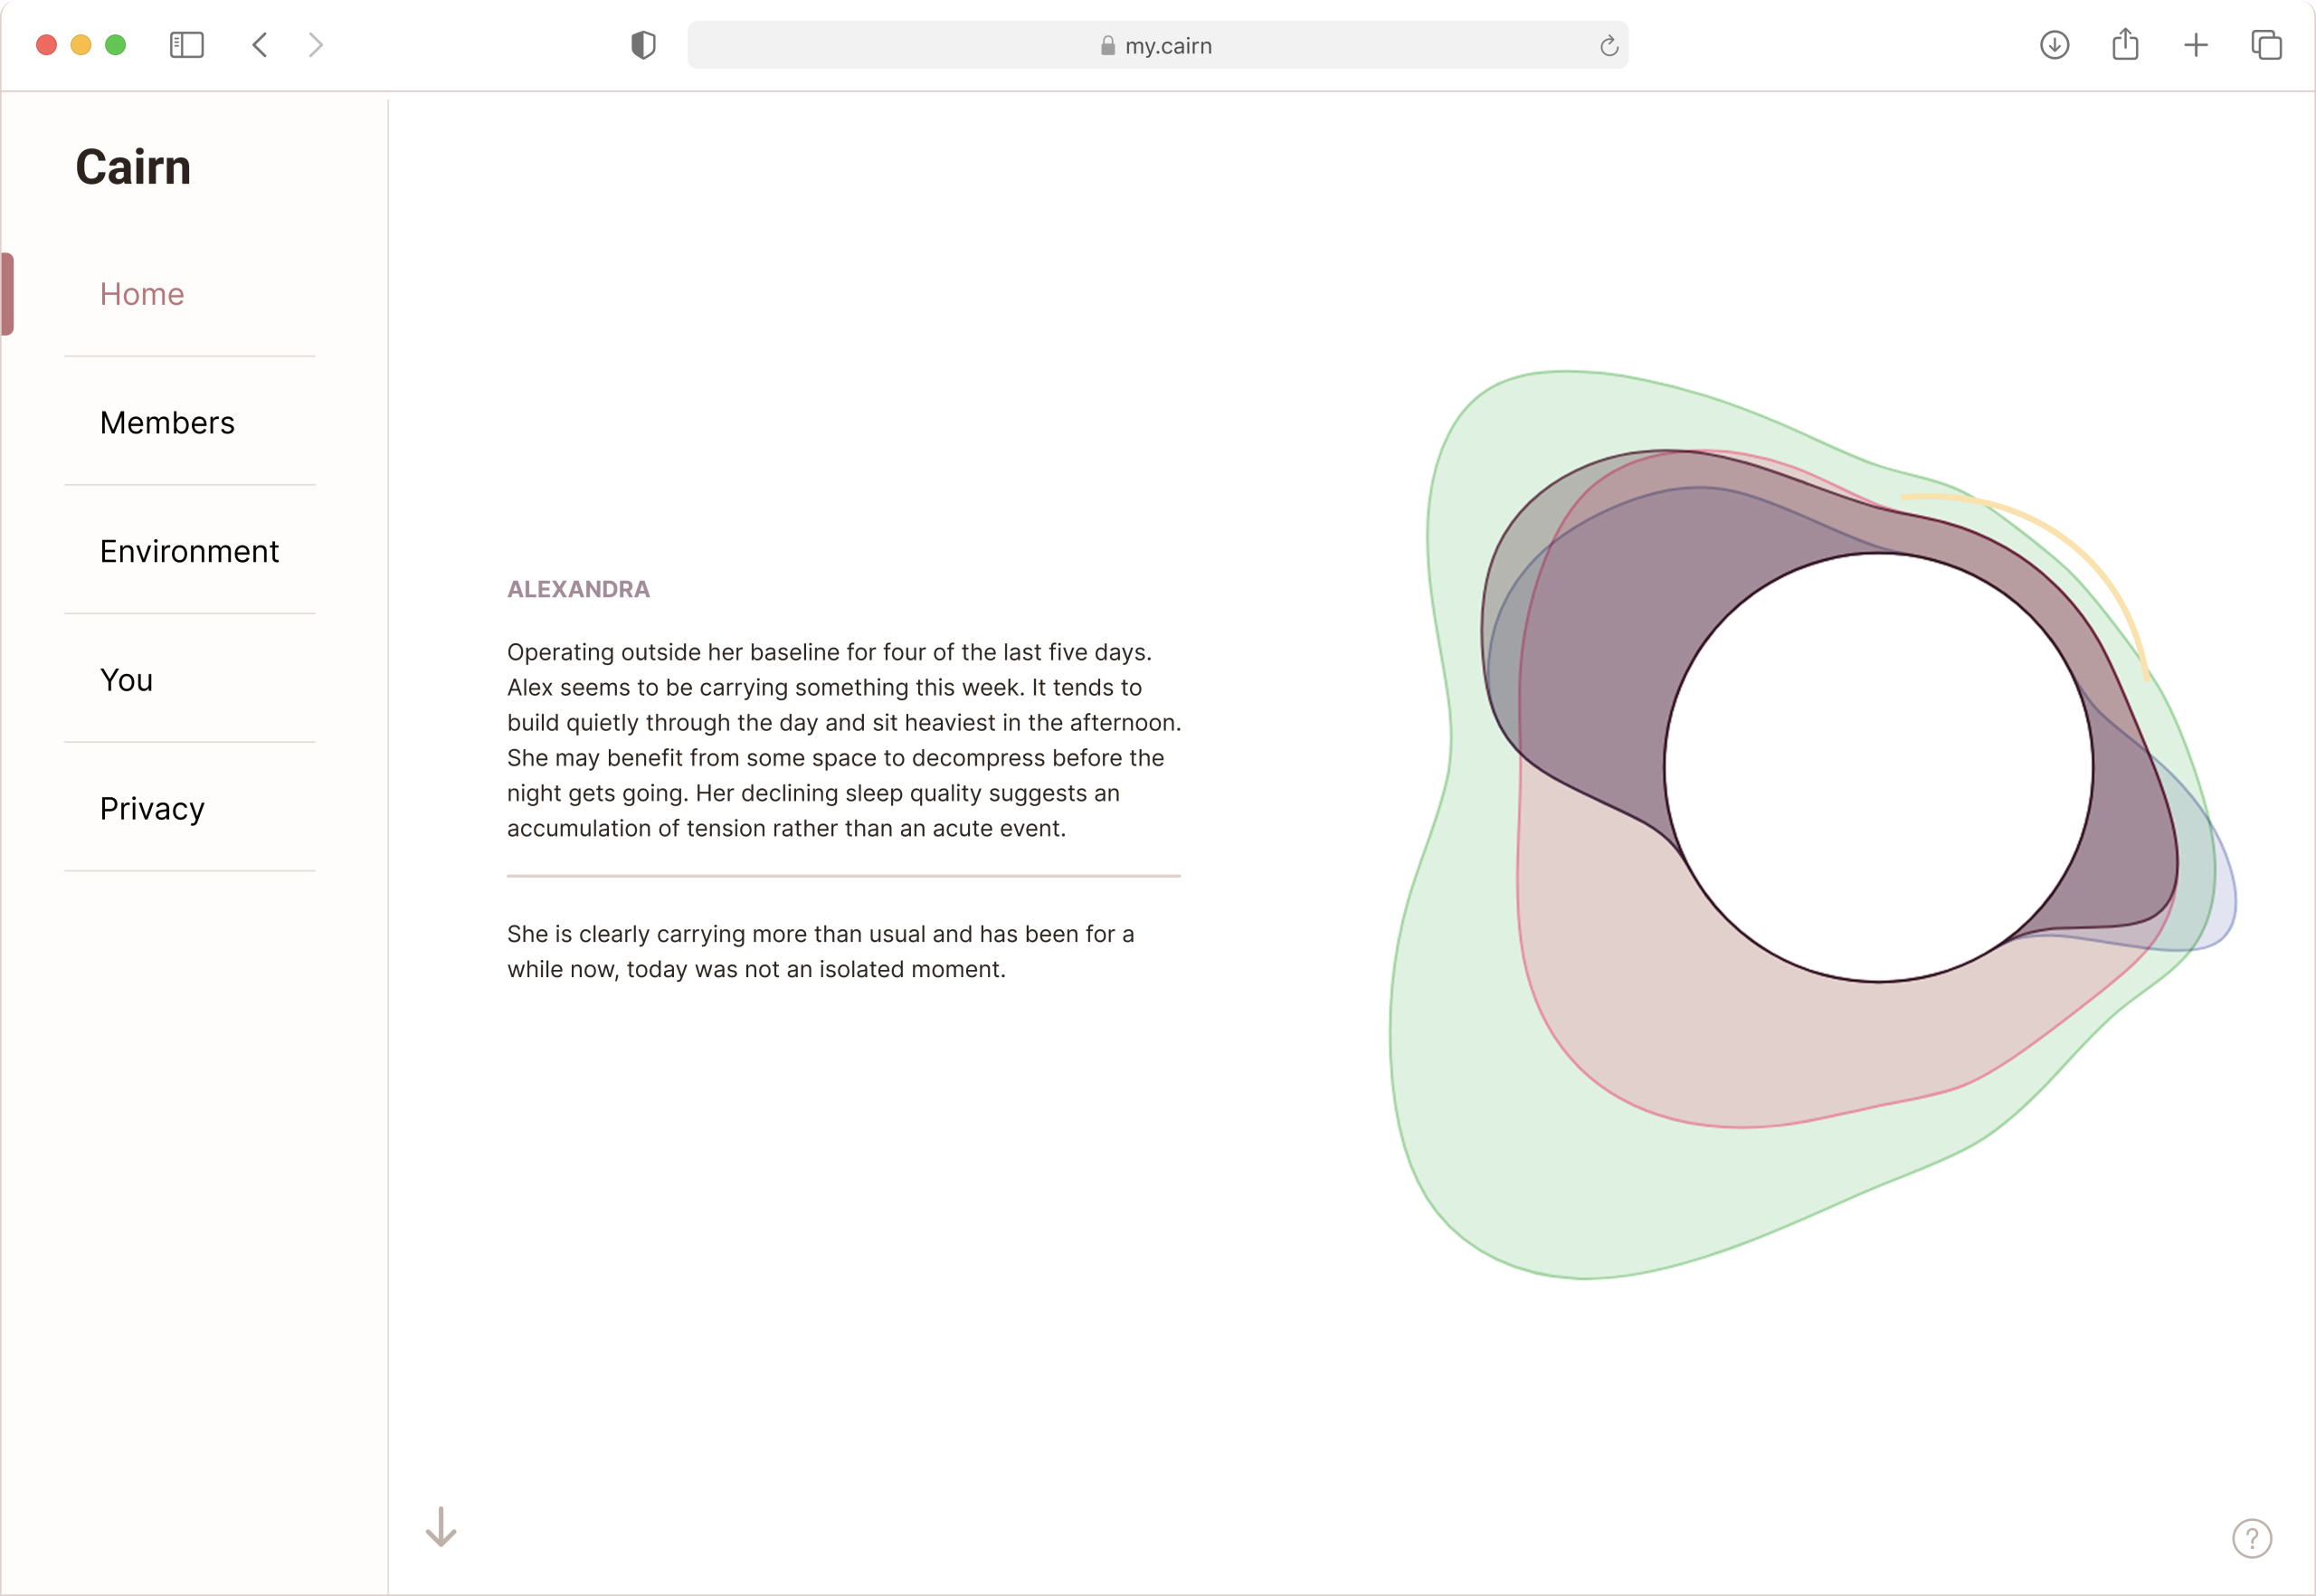
All data visualizations for the user-facing side were created using Google’s Gemini to create my own graph-building tool. I then put the visualizations into Figma to design the full interface, and used Claude Code to bring it to life.
The images above show suggestions as to how to display the data if it existed. First the aggregate, then presentation of the unique individual visualizations, and lastly individual inferences with personal details omitted.